Real estate finance and REIT valuation look complex from the outside, but they are built on a few simple questions: who puts in the capital, how does the property generate cash, and how is that cash shared between lenders and investors. Once you see those mechanics, the models and spreadsheets stop being intimidating and start becoming useful decision tools.
Let’s unpack all these mechanics step by step and connect them to the metrics investors use NOI, FFO, AFFO, NAV, and valuation multiples so you can read, build, or explain a basic REIT or property model with confidence.
Q1. What does real estate finance actually mean?
Real estate finance is simply the way money is raised, structured, and managed around property investments. In other words, it looks at where the capital comes from, how the property generates cash, and how that cash is distributed between lenders and owners over time.
Practically, real estate finance covers three core areas:
- Capital in – How much comes from debt vs equity, on what terms (interest rate, LTV, maturity, covenants).
- Cash flow through – How rent, vacancies, operating expenses, and capex turn into NOI and then into cash available for debt service and investors.
- Returns out – How investors get paid (interest, principal, dividends, capital gains) and what risk they take for that return.
Because properties are long-lived, illiquid, and usually leveraged, real estate finance also focuses heavily on risk management: refinancing risk, interest-rate risk, tenant risk, and market cycles.
If you were to put this into a simple Excel model, “real estate finance” is everything that sits between:
Purchase price & financing assumptions → Cash flow schedule → Returns to debt and equity.
Q2. How is real estate typically financed?
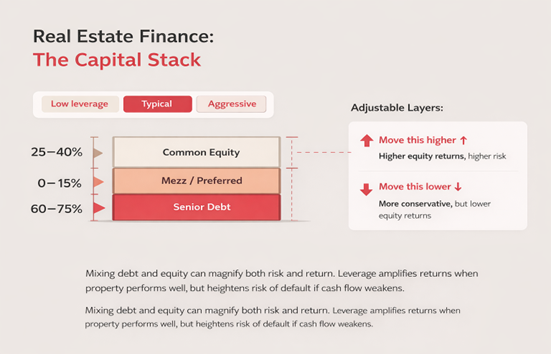
Real estate is usually financed with a mix of debt and equity, often called the capital stack. Debt is borrowed money that must be repaid with interest; equity is the owners’ capital that takes more risk but also shares in the upside.
In a standard deal:
- Equity
- Comes from individuals, institutions, private equity funds, or a REIT
- Takes the first loss if the project underperforms
- Earns residual cash flows after all expenses and debt service
- Debt
- Comes from banks, mortgage lenders, insurance companies, CMBS markets, or private credit funds
- Has a contractual claim on interest and principal
- Is usually secured by the property (the lender can foreclose if payments stop)
A typical structure might look like this:
- 60–75% senior debt (bank loan or mortgage)
- 0–15% mezzanine debt or preferred equity (higher-cost, second-ranking capital)
- 25–40% common equity (sponsor + investors)
This mix matters because leverage amplifies outcomes:
- If the property performs well, equity returns can be high because part of the purchase was funded with cheaper debt.
- If performance weakens, high debt levels can quickly erode equity and increase default risk.
In a simple Excel model, you’d capture this in an assumptions block:
- Purchase price or development cost
- Loan-to-value (LTV)
- Interest rate and amortization
- Equity contribution and expected return
Q3. What is a REIT, and how is it different from owning property directly?
A REIT (Real Estate Investment Trust) is a company that owns, operates, or finances income-producing real estate and distributes most of its earnings to shareholders as dividends. Instead of buying a building yourself, you buy shares in a portfolio of properties managed by professionals and traded on the stock market.
Here’s the core difference:
| Aspect | Direct Property | REIT Investment |
| Ownership & Control | Full direct control over the asset | No direct control over specific properties |
| Liquidity | Illiquid – selling takes time and high transaction costs | Highly liquid – shares traded on stock exchanges |
| Risk Concentration | Concentrated in a few assets/locations | Diversified across many assets and tenants |
| Management Responsibility | Hands-on: tenants, repairs, financing, compliance | Professionally managed by a dedicated management team |
| Capital Requirement | High upfront capital needed | Lower entry ticket; can invest smaller amounts |
| Information & Reporting | Limited, private, appraisal-based | Regular, audited public financial reporting |
Most REITs must also meet regulatory conditions (such as distributing a high percentage of taxable income as dividends and focusing primarily on real estate assets), which makes them structurally oriented toward income generation.
In short, direct ownership gives you control and concentration; REITs give you diversification, liquidity, and access to institutional-scale real estate through a listed vehicle.
Q4. How are REITs valued?
REITs are valued mainly on their cash-generating ability and the market value of their underlying properties, rather than just accounting earnings like EPS. Investors focus on how much recurring cash flow the portfolio produces, what the real estate is worth in the private market, and how much they’re paying for each unit of that cash flow.
In practice, REIT valuation usually combines three lenses:
- Cash Flow (Income Lens)
- Start from portfolio NOI (Net Operating Income).
- Adjust for interest, overhead, and non-cash items to get FFO and AFFO.
- Use Price-to-FFO or Price-to-AFFO multiples, like P/E but tailored for real estate.
- Asset Value (NAV Lens)
- Estimate what the properties would be worth if sold at current market cap rates.
- Subtract net debt and other obligations to get NAV per share.
- Compare current share price to NAV (premium vs discount).
- Yield & Total Return (Investor Lens)
- Look at dividend yield relative to AFFO and bond yields.
- Consider expected growth in FFO/AFFO and potential changes in NAV over time.
A simple REIT model will therefore project NOI, build up to FFO and AFFO, estimate NAV, and then compare the current share price to these metrics. The goal isn’t to hit a single “perfect” number, but to see whether the market price looks reasonable relative to the REIT’s cash flows and asset base.
Q5. What metrics are used to value REITs?
REITs are mainly valued using four core metrics: FFO, AFFO, NAV, and Price-to-FFO. Together, these tell you how much cash the REIT generates, what its assets are worth, and how the market is pricing that combination.
Here’s what each one does at a high level:
| Metric | What it Measures / Definition | Primary Use |
| FFO (Funds From Operations) | Adjusts net income to remove non-cash and non-recurring items, especially real estate depreciation and gains/losses on property sales. | Measures underlying operating performance of the REIT’s core property portfolio. |
| AFFO (Adjusted Funds From Operations) | Starts from FFO and subtracts recurring capital expenditures and leasing-related costs. | Acts as a proxy for sustainable, distributable cash flow and dividend capacity. |
| NAV (Net Asset Value) | Estimates equity value based on the market value of properties minus net debt and other obligations. | Assesses whether the REIT trades at a discount or premium to its underlying real estate. |
| Price-to-FFO (P/FFO) | Share price divided by FFO per share, similar to a P/E ratio but adjusted for real estate specifics. | Compares valuation across REITs, sectors, and history using a cash-flow-oriented multiple. |
In practice, analysts rarely rely on a single metric. A typical valuation view will look at P/FFO, P/AFFO, dividend yield, and discount/premium to NAV together to form a judgment about whether a REIT looks cheap, fair, or expensive.
Q6. What is FFO, and why is it important?
FFO (Funds From Operations) is a REIT-specific profit metric that adjusts net income to better reflect recurring, core operating performance. It mainly adds back non-cash real estate depreciation and strips out gains or losses from property sales, which can distort traditional earnings.
The problem with using net income or EPS for REITs is that accounting depreciation assumes buildings lose value in a straight line, even when good properties can remain stable or appreciate. That makes net income look artificially low. At the same time, one-off gains from selling assets can make a weak year look strong.
FFO is important because:
- It gives a more realistic view of ongoing earnings power
- It’s the base for key metrics like FFO per share and Price-to-FFO (P/FFO)
- Investors and analysts use it to assess dividend coverage, growth trends, and relative valuation
In a basic REIT model, you’ll often see a dedicated FFO section that reconciles from net income, making it easy to track how operational performance is evolving over time.
Q7. What is AFFO, and how is it different from FFO?
AFFO (Adjusted Funds From Operations) is an estimate of the REIT’s recurring cash flow that is realistically available to shareholders after maintaining the properties. It starts from FFO and then adjusts for ongoing costs that FFO ignores.
Compared to FFO, AFFO typically:
- Subtracts maintenance capex – recurring spend to keep assets rentable
- Subtracts leasing costs – tenant improvements and leasing commissions
- May include other recurring adjustments depending on the REIT
In simple form:
AFFO = FFO – Maintenance capex – Leasing/recurring capitalized costs
AFFO is important because it’s often seen as the best proxy for sustainable, distributable cash flow. Investors use AFFO per share and dividends ÷ AFFO to judge how secure the dividend is and how much room there is for growth.
In short: FFO cleans up earnings; AFFO gets closer to what can actually be paid out.
Q8. What is NAV in REIT valuation?
NAV (Net Asset Value) estimates what a REIT’s equity is worth based on the market value of its properties minus net debt, on a per-share basis. It’s essentially: what would shareholders get if the portfolio were sold at current market prices and the debt was repaid?
The logic is straightforward:
Value the properties
- Take NOI and apply a market cap rate → Property value ≈ NOI ÷ cap rate
- Sum across assets → Gross Asset Value (GAV)
Subtract obligations
- GAV – Net debt – Other claims = Equity NAV
Divide by shares
-
- Equity NAV ÷ Shares outstanding = NAV per share
Investors then compare share price vs NAV per share:
- Price > NAV → premium
- Price < NAV → discount
That premium/discount is a key signal for whether the REIT is priced above or below the implied value of its underlying real estate.
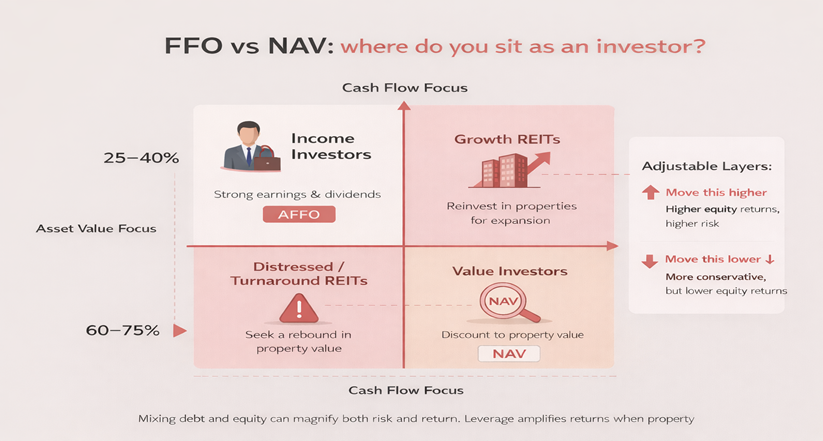
Q9. Is FFO or NAV more important?
FFO and NAV are both important, but for different reasons. Which one matters more depends on your goal and the type of REIT you’re looking at.
FFO / AFFO – Income & operations
- Focus: How strong and sustainable is the cash flow?
- Useful for income-focused investors and steadier sectors (e.g., residential, net lease, many industrial/retail).
- Main tools: FFO/AFFO per share, payout ratio, P/FFO, P/AFFO.
NAV – Asset value & upside
- Focus: What are these properties worth privately, and what am I paying vs that value?
- Useful for value or event-driven strategies, and more cyclical/asset-sensitive sectors (e.g., office, hotels).
- Main tools: NAV per share, discount/premium to NAV, implied cap rate.
In practice, good REIT analysis uses both:
FFO/AFFO to judge earnings and dividends, and NAV to judge asset value and re-rating potential.
Q10. How is REIT valuation different from traditional real estate valuation?
Traditional real estate valuation typically focuses on a single property or project, while REIT valuation focuses on a diversified portfolio traded in public markets. That introduces liquidity, sentiment, and corporate-level factors.
Key differences:
| Aspect | Traditional Property Valuation | REIT Valuation |
| Unit of analysis | One asset or project valued using sales comps, cap rates, or DCF. | Dozens or hundreds of assets plus corporate overhead, debt, and management. |
| Pricing mechanism | Appraisals and negotiated deals; values update slowly. | Share price moves daily, driven by fundamentals, market flows, sentiment, and macro news. |
| Capital structure | You model a specific loan and equity injection for the asset. | You inherit a full balance sheet (secured/unsecured debt, bonds, preferreds) and assess leverage, maturity, and refinancing risk. |
| Liquidity & sentiment | Real estate is illiquid; prices are sticky and slow to adjust. | REITs can trade at large discounts or premiums to NAV, reflecting expectations, fear, or optimism more than instant changes in building values. |
So, a REIT can trade at a 20–30% discount to its best estimate of NAV, not because the buildings suddenly lost that much value, but because investors are pricing in risk, uncertainty, or future stress.
Q11. How do interest rates affect REIT valuation?
Interest rates affect REITs through borrowing costs, property values, and relative yield. When rates move up, REITs often face valuation pressure—but the impact depends on leverage, debt structure, and sector.
Main channels:
- Borrowing costs
Higher rates make new debt and refinancing more expensive, which can reduce FFO/AFFO, especially for highly leveraged REITs or those with short-term / floating-rate debt. - Cap rates & asset values
Over time, higher rates tend to push cap rates up, which lowers property values and NAV. That can widen discounts to NAV or put downward pressure on share prices. - Relative yield vs bonds
Investors compare REIT dividend yields to bond yields. If bond yields rise, REITs may need higher yields (i.e., lower prices) to stay competitive.
Not all REITs are equally sensitive: those with mainly fixed-rate debt, longer leases, and strong rent growth can absorb rate moves better than highly leveraged, short-duration names.
Q12. What are common mistakes people make when valuing REITs?
Most mistakes happen because people treat REITs like normal stocks or like single properties, instead of listed real estate vehicles.
Big ones to avoid:
- Using P/E instead of P/FFO or P/AFFO
Net income is distorted by depreciation and one-offs, so P/E is often meaningless.
→ Use FFO/AFFO per share, P/FFO, P/AFFO as your main valuation multiples. - Ignoring leverage and debt terms
Same yield, very different risk if one REIT has high leverage, short or floating-rate debt.
→ Always check LTV, net debt/EBITDA, interest cover, and debt maturity profile. - Treating all REITs as comparable
Office, retail, logistics, data centers, residential, healthcare all have different risk and growth.
→ Compare within the same sector first, then vs the wider REIT market. - Looking only at history, not the macro backdrop
Using “average” multiples without considering rates, inflation, and sector trends can mislead. - Chasing high dividend yield without coverage analysis
A very high yield can signal distress.
→ Test dividend ÷ AFFO (payout ratio) and balance sheet strength, not yield alone.
Good REIT valuation is mainly about using the right metrics and respecting leverage, sector, and macro context.
Q13. How do investors decide if a REIT is overvalued or undervalued?
Investors decide by comparing the REIT’s price to its cash flow, asset value, peers, and its own history. They don’t rely on a single metric.
Key checks:
P/FFO and P/AFFO
- Compare to the REIT’s own history, its sector peers, and the broader REIT market.
- Much higher multiples with no clear reason can suggest overvaluation; much lower can suggest undervaluation or higher risk.
Price vs NAV
- Compare share price to NAV per share.
- Big premium → market paying up for quality, growth, or management.
- Big discount → concerns about assets, leverage, or sector outlook.
Dividend yield vs coverage and risk
- Check dividend yield against AFFO yield, peers, and bond yields.
- Very high yield + weak AFFO coverage often signals stress, not a bargain.
Growth and balance sheet
- Strong growth and conservative leverage can justify higher multiples.
- Low growth + high leverage usually deserve a valuation discount.
In practice, investors look for alignment across P/FFO, NAV, yield, growth, and balance sheet to judge whether a REIT looks cheap, fair, or expensive.
Q14. What’s the right way to think about real estate finance and REIT valuation?
The cleanest way to think about real estate finance and REIT valuation is as a simple chain: cash flow → capital structure → asset value → market price.
A practical lens:
- Start with cash flow
- How does the property or portfolio make money?
- Rents, occupancy, operating costs → NOI.
- Add the capital structure
- How is that NOI split between debt and equity?
- Look at leverage, interest cost, fixed vs floating, and refinancing risk.
- Translate into REIT metrics
- From NOI to FFO and AFFO (earnings and distributable cash flow).
- From NOI and cap rates to NAV (underlying asset value).
- Compare metrics to market price
- Use P/FFO, P/AFFO, discount/premium to NAV, and dividend yield/payout to see what the market is implying about risk and return.
Leave a Reply
Your email address will not be published. Required fields are marked *