Launching a startup is exciting but without a financial model, it’s like sailing without a compass. Research shows 82% of startups fail due to poor cash flow management.
A strong financial model is not just a spreadsheet. It’s your financial roadmap:
- Forecasts your runway and survival.
- Guides better decisions (hiring, scaling, expansion).
- Builds investor confidence with credible numbers.
What is Financial Modeling for Startups?
A financial model is a structured tool, usually built in Excel or Google Sheets, that projects your startup’s financial performance. It helps founders, investors, and stakeholders make data-driven decisions.
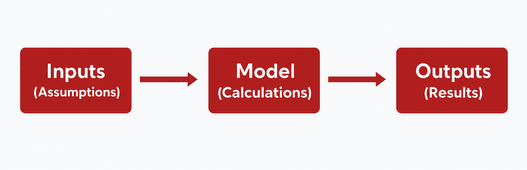
A complete startup model typically includes three layers:
- Inputs (Assumptions): Revenue drivers, churn rate, customer acquisition cost (CAC), operating costs.
- Model (Calculations): Revenue forecasts, expenses, profitability, cash flow.
- Outputs (Results): Financial statements, scenario analysis, dashboards, and valuation metrics.
Unlike large corporations, startups operate with high uncertainty. This makes it critical for startup models to be flexible, scenario-based, and updated regularly.
Color-Coding Convention (Best Practice)
Use consistent colors to keep your model clear and easy to update:
- Pink/Blue: Inputs (assumptions like pricing, churn, growth).
- Black: Calculations (formulas).
- Grey: Outputs (results such as revenue, EBITDA, runway).
💡 Tip: Add a legend at the top so users instantly understand the scheme.
Why Financial Modeling is Essential for Startups
Here’s what a financial model does for you:
- Survival Planning – Forecasts runway, prevents cash crunch.
- Strategic Decisions – Shows impact of hiring, pricing, expansion.
- Investor Confidence – VCs/angels want numbers, not guesses.
- Risk Management – Test “what if” scenarios before committing.
- Strategic RoadMap – Plan expansion without burning too fast.
Step-by-Step Guide: How to Build a Startup Financial Model
Step 1. Sources & Uses of Funds
The first step in any financial model is to clearly outline where the money is coming from and how it will be deployed. Investors want immediate clarity on capital inflows and spending priorities.
- Sources of Funds = Inflows (VCs, angel investors, debt, grants, founder capital, bank loans).
- Uses of Funds = Allocation (product development, marketing, hiring, operating expenses, CAPEX, working capital).
Example:
| Sources | Amount |
| VC Investment | $1.5M |
| Grant | $500k |
| Founder Capital | $100k |
| Total Funds | $2.1M |
| Uses of Funds | Amount |
| Product Development | $500k |
| Marketing & Sales | $400k |
| Hiring | $600k |
| Operations & CAPEX | $600k |
| Total Uses of Funds | $2.1M |
💡 Always ensure Sources of Funds = Uses of Funds (balanced table).
Step 2. Revenue Projections
Revenue modeling depends on the business model. Different industries → different drivers:
- SaaS: MRR, ARR, churn, customer acquisition cost, expansion revenue.
- E-commerce: Average Order Value (AOV), order volume, fulfillment costs.
- Marketplaces: Gross Merchandise Value (GMV), take rate, user acquisition funnel.
- Hardware/Deep Tech: High CAPEX, long sales cycles, unit economics.
SaaS Example:
- Inputs: Marketing spend, CPM, visitor-to-signup rate, signup-to-customer conversion, churn rate.
- Formula: Customers × Subscription Price.
- E.g., $20/month subscription × 500 customers = $10,000 MRR.
Product Businesses:
- Use TAM → SAM → SOM to estimate potential customers.
- Customers × Product Price = Projected Revenue.
Step 3. Cost of Goods Sold (COGS)
- Product Startups: raw materials, manufacturing, packaging, shipping.
- SaaS Startups: hosting, maintenance, customer support, third-party software.
Step 4. Operating Expenses (OPEX)
Typical expense categories include:
- Sales & Marketing
- Advertising, promotions, digital campaigns
- Customer success, partnerships
- General & Administrative
- Salaries, rent, utilities, insurance, maintenance
- Legal, accounting, HR, software tools
💡 Pro Tip: Marketing expenses usually scale faster than revenues — plan realistically.
Step 5. Capital Expenditures (CAPEX)
Capital expenditures represent long-term investments in assets that support business growth and efficiency.
- Examples: servers, hardware, intellectual property (IP), office setup, and machinery.
- Accounting treatment: Spread over the asset’s useful life through depreciation.
💡 Example: A $50,000 equipment purchase with a 5-year useful life is expensed gradually, not all at once.
Step 6. Hiring Plan
A structured hiring plan helps forecast salary and benefits:
- Define roles, start dates, and base salaries.
- Set headcount per role and factor in annual salary increments.
- Include employee benefits as a percentage of base salary.
- Calculate total monthly and annual payroll costs.
💡 Tip: Align your hiring plan with growth milestones (e.g., product launch, new market entry) to avoid over- or under-staffing.
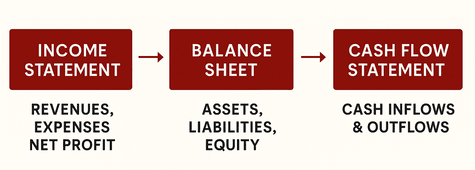
Step 7. The Three Financial Statements
Every complete model includes:
- Income Statement → Revenues, Expenses, Net Profit.
- Balance Sheet → Assets, Liabilities, Equity.
- Cash Flow Statement → Cash inflows and outflows (operating, investing, financing).
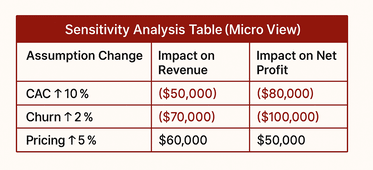
Step 8. Scenario & Sensitivity Planning
Financial models should not be static. They need to capture uncertainty and risk through two approaches.
- Scenario Planning (macro view): Best Case, Base Case, Worst Case.
- Sensitivity Analysis (micro view): What if churn rises 2%? What if CAC increases 10%?
💡 Pro Tip: Always stress test churn, CAC, and pricing assumptions.
Step 9. Break-even Analysis
Break-even analysis identifies the sales volume at which total revenues equal total costs, meaning the business is neither making a profit nor a loss.
- Formula: Break-even (units) = Fixed Costs ÷ (Unit Price – Variable Cost).
- Example: $100k fixed costs ÷ ($50 – $30) = 5,000 units.
💡 Example: If fixed costs = $100,000, unit price = $50, and variable cost = $30, then Break-even = 100,000 ÷ (50 – 30) = 5,000 units.
Step 10. Interactive Dashboard
Finally, build a dashboard to visualize key performance indicators (KPIs):
- Graphs, charts, pie charts, and trend lines.
- Show revenue growth, cash burn, runway, and profitability timeline.
7. Types of Financial Models
Different models serve different purposes — here are the most common for startups:
- 3-Statement Model → Core foundation linking Income Statement, Balance Sheet, and Cash Flow.
- DCF Model → Used for fundraising and valuation based on projected cash flows.
- TAM/SAM/SOM Model → Market sizing framework to estimate revenue potential.
- Cohort Model → Analyzes retention, churn, and customer lifetime value (LTV).
- Fundraising Model → Tracks dilution, exits, and cap table scenarios.
Types of Financial Models Startups Can Use
Different models serve different purposes — here are the most common for startups:
- 3-Statement Model → Core foundation linking Income Statement, Balance Sheet, and Cash Flow.
- DCF Model → Used for fundraising and valuation based on projected cash flows.
- TAM/SAM/SOM Model → Market sizing framework to estimate revenue potential.
- Cohort Model → Analyzes retention, churn, and customer lifetime value (LTV).
- Fundraising Model → Tracks dilution, exits, and cap table scenarios.
Common Pitfalls to Avoid in Financial Modeling
Even with the best intentions, startups often make mistakes in their financial models. Here are some common errors and how to avoid them:
| Common Mistake | Best Practice |
| Overestimating revenue | Use conservative assumptions & sensitivity analysis |
| Ignoring churn or delays | Model churn rates & payment timelines explicitly |
| Underestimating OPEX | Build detailed OPEX categories & stress test |
| Overcomplicating the model | Keep structure simple & driver-based |
| Not updating regularly | Refresh quarterly (or more often if fundraising) |
Tools for Building a Financial Model
Choosing the right tool depends on your stage, needs, and resources:
|
Why Financial Modeling is a Must-Have for Startups
For startups, financial modeling is more than just crunching numbers — it’s about building the financial roadmap of your business. A strong model helps you navigate uncertainty, allocate resources wisely, and earn investor confidence. Just as importantly, it keeps you from falling into the financial traps that cause many early-stage companies to fail.
Key Benefits
- Cash Flow Clarity: Forecast when money comes in and goes out, so you know how long your runway truly is.
- Investor Confidence: Provide a clear, data-backed growth story that shows how your startup will scale.
- Risk Management: Use scenario planning to anticipate risks and prepare for best, base, and worst cases.
- Smarter Decisions: Ground your strategy in realistic revenue, expense, and cash flow assumptions.
The takeaway: A well-structured financial model is a startup’s secret weapon. It transforms a vision into a credible growth plan, helping you move from idea to sustainable, scalable business.
At Capidel Consulting, we provide expert financial and strategic advisory services designed to drive growth and sustainability. Partner with us for tailored solutions that meet your business needs. And if you need a ready made excel sheet, you can download it right here!
Leave a Reply
Your email address will not be published. Required fields are marked *