Find A Free Sample to Work With!
E-commerce is one of the most dynamic business models in today’s digital economy. The low barrier to entry, access to global customers, and data-driven marketing have enabled thousands of online stores to launch each month. Yet, behind every successful e-commerce brand lies a solid financial foundation, one that translates traffic, conversions, and ad spend into meaningful financial insights.
A financial model acts as the blueprint of your e-commerce business. It helps founders understand how sales are generated, where money is spent, and when the business becomes profitable. Without a structured model, it’s easy to overspend on marketing, mismanage inventory, or misjudge funding requirements.
Whether you are preparing to pitch investors, planning next quarter’s ad budget, or forecasting inventory levels, a well-built financial model provides the clarity you need to make informed decisions. In this guide, we’ll walk through the process of building a complete e-commerce financial model, from identifying key revenue drivers to creating investor-ready projections.
By the end, you’ll understand not only how to structure your model but also how to interpret the numbers that define sustainable growth.
Why E-Commerce Startups Need a Financial Model
E-commerce financial model is a decision-making framework that helps founders understand how every marketing dollar, inventory purchase, or pricing change impacts the bottom line. It turns assumptions into measurable outcomes and connects business strategy with financial reality.
When approaching investors or banks, your financial model becomes your credibility check. Investors look for clear evidence that you understand your revenue engine, customer acquisition process, and cost structure. A strong model communicates that your business is scalable and sustainable.
For Fundraising
It should highlight your unit economics, especially Customer Acquisition Cost (CAC) and Lifetime Value (LTV). These two metrics tell investors how efficiently you convert marketing spend into long-term profits.
💡 Try this quick check:
Estimate your CAC by dividing your total marketing spend last month by the number of new customers acquired. Then calculate your LTV using the formula:
LTV = Average Order Value × Gross Margin × Repeat Purchase Rate
If your LTV:CAC ratio is above 3:1, your business model is attractive to investors. If not, consider refining your marketing strategy or pricing structure.
For Managing Cash Flow
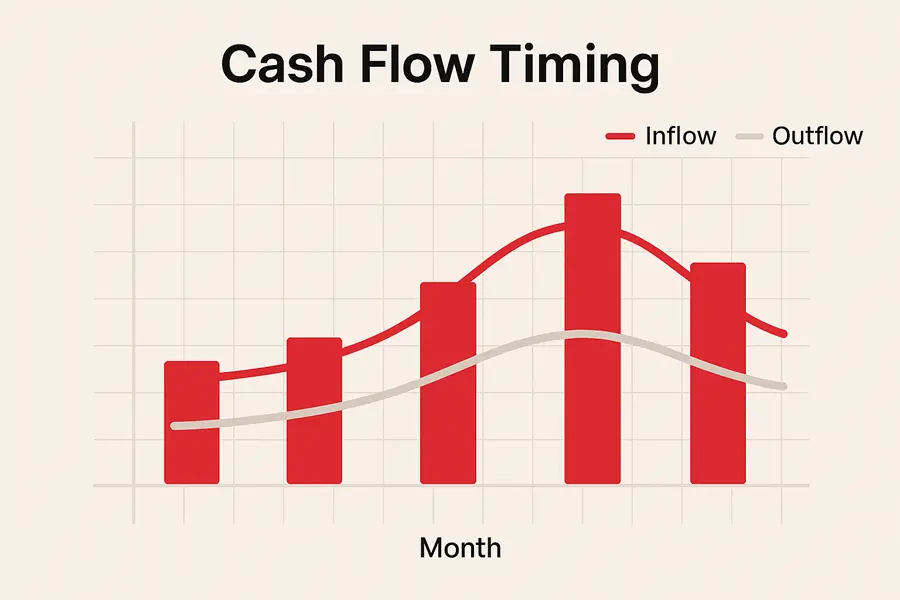
E-commerce businesses often spend heavily before earning revenue. You might pay for ad campaigns, order inventory, or cover fulfillment costs weeks before customer payments clear. Without a financial model, this timing gap can quickly cause cash shortages.
A cash flow forecast helps you visualize when money enters and leaves the business. It answers key questions:
- How long will your current cash last?
- When will you need to reorder inventory?
- What happens if ad costs rise by 20 percent next quarter?
With a simple model, you can simulate these situations and plan ahead rather than react under pressure.
For Growth Decisions
Every e-commerce growth strategy has financial consequences. Increasing your ad budget, expanding product lines, or launching into a new market all change your cost and revenue structure. A model allows you to test these decisions before you commit resources.
For example, increasing your conversion rate by just 0.5 percent could add thousands in monthly revenue with the same traffic and ad spend. On the other hand, reducing fulfillment costs by 10 percent might significantly improve your gross margin.
Scenario simulation:
Imagine your online store attracts 20,000 visitors monthly with a 2 percent conversion rate and an average order value of $60.
- At baseline, revenue = 20,000 × 2% × $60 = $24,000.
- If the conversion rate rises to 2.5 percent, revenue = $30,000.
That simple change adds $6,000 in sales without increasing traffic. Embedding interactive sliders or editable cells on your blog can help readers see this impact live.
Key Components of an E-Commerce Financial Model
A strong e-commerce financial model is built around a few key components that capture how your business actually operates. Each component connects directly to your profit and cash flow, so understanding and linking them properly is essential for accuracy and investor confidence.
Revenue Forecasting
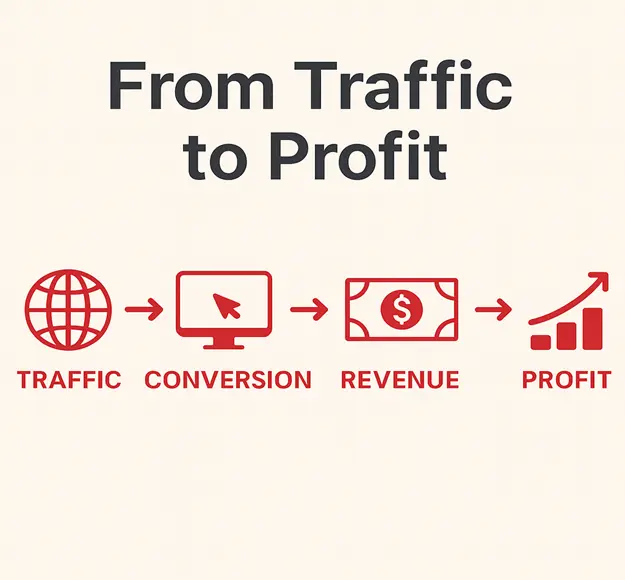
Revenue forecasting is the backbone of your model. It translates your marketing and traffic data into actual sales projections. Start by mapping your conversion funnel:
Website Traffic → Conversion Rate → Average Order Value (AOV) → Revenue
Example:
50,000 visitors × 2% conversion × $60 AOV = $60,000 monthly revenue.
Different e-commerce business types forecast revenue in unique ways:
Subscription businesses focus on recurring revenue and churn.
One-time sales stores depend on new customer growth and repeat purchase rates.
Marketplaces earn commission on total gross merchandise value (GMV) instead of direct product sales.
Cost of Goods Sold (COGS)
COGS includes every cost directly tied to producing or delivering your products. For e-commerce, that typically means:
- Product manufacturing or purchase cost
- Packaging and labeling
- Shipping and fulfillment fees
- Payment processing charges
To keep your model realistic, break these into variable costs (which scale with sales, like packaging and shipping) and fixed costs (which remain constant, such as warehouse rent or software fees tied to fulfillment).
Example:
If each unit costs $18 and you sell 3,000 units, COGS = $54,000.
💡 Pro tip: Track COGS per order. This lets you instantly see how supplier pricing or logistics changes affect your margins.
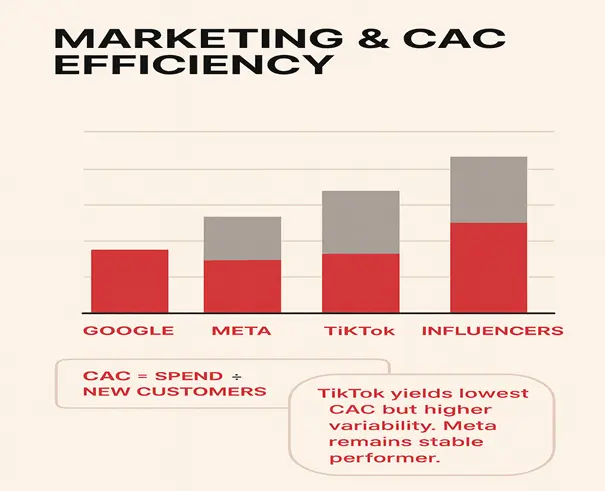
Marketing & Customer Acquisition
Marketing is the engine that drives sales, but it’s also one of the most cash-intensive parts of an e-commerce model. Most founders underestimate how much capital it consumes.
Include all major paid channels such as Google Ads, Meta (Facebook/Instagram), TikTok, and influencer collaborations. The key metric to monitor is Customer Acquisition Cost (CAC):
CAC = Total Marketing Spend ÷ New Customers Acquired
If you spent $10,000 on ads and gained 400 new customers, CAC = $25.
Your model should tie CAC directly to your marketing budget and expected growth rate.
Operating Expenses
Operating expenses (OPEX) include the recurring costs required to keep your business running smoothly but not directly tied to each sale. Typical categories include:
- Salaries or contractor payments
- Office or warehouse rent
- E-commerce platform subscriptions (Shopify, Klaviyo, Gorgias)
- Customer service and tech stack costs
- Fulfillment and logistics management
Segmenting OPEX into fixed and variable components helps you forecast scalability. Fixed expenses determine your baseline burn rate, while variable costs show how spending changes as you grow.
🧠 Think about this:
What percentage of your total expenses is fixed? High fixed costs make you less flexible, whereas a higher variable cost structure allows leaner scaling
CAC/LTV Analysis
This is the investor’s favorite part of an e-commerce financial model. It reveals whether your business can acquire and retain customers profitably.
Customer Lifetime Value (LTV) estimates the total revenue you earn from a customer over their entire relationship with your brand. A simple version of the formula is:
LTV = Average Order Value × Gross Margin × Repeat Purchase Rate
Example:
$60 × 60% × 3 = $108 LTV.
If CAC = $25 → LTV: CAC = 4.3:1, a healthy ratio.
🧩 Quick test:
Use your own numbers and calculate the ratio. If it’s below 3:1, it signals you need to improve retention, pricing, or acquisition efficiency.
This ratio also determines how much you can safely reinvest in growth without burning cash too fast. Investors rely on it to judge scalability and sustainability.
Investor Expectations for E-Commerce Models
Investors look for clarity, scalability, and profitability in an e-commerce financial model. Your model should clearly show how the business earns, grows, and sustains profits.
- Clear unit economics highlights CAC, LTV, and contribution margin to show profitable customer acquisition.
- Scalable acquisition proves that marketing spend can grow without sharply increasing CAC.
- Healthy margins (35–60%) demonstrate strong pricing and cost control that ensures sustainable profitability.
- Sensitivity scenarios include best and worst cases to show how the business performs under changing costs or conversion rates.
A concise, data-backed model with these elements builds trust and signals that you understand your growth.
Free E-Commerce Financial Model Templates & Examples
Looking for real examples of e-commerce financial plans?
These templates show you exactly how successful founders structure their models from traffic forecasts to profit calculations.
You’ll get:
- E-Commerce Financial Model Excel Template
Forecast sales, track growth, and understand how conversion rates affect revenue. - Marketing Budget Model
Plan ad spend and see how each dollar drives customer acquisition and ROI. - E-Commerce P&L Statement Example
Understand your cost structure and profitability at a glance.
Start with these free models and adapt them for your own business.
Common Mistakes to Avoid
Even well-built models can fall short if key assumptions or metrics are overlooked. Here are the most common pitfalls to watch for:
- Ignoring churn – Failing to track customer drop-off inflates revenue projections, especially in subscription models.
- Underestimating marketing costs – Ad prices fluctuate as competition grows. Always test sensitivity for CAC and ROAS changes.
- Poor inventory planning – Overstocking locks up cash, while stockouts lose sales. Forecast demand and lead times carefully.
- Focusing on vanity metrics – Traffic and followers don’t drive profit. Focus on conversion rate, AOV, repeat purchase rate, and margin.
- Not updating assumptions – Markets, costs, and behavior shift. Review your model monthly to reflect current data.
- Ignoring cash flow timing – Revenue may look strong on paper, but delays in payments or upfront ad spend can strain liquidity.
- Overestimating growth rates – Use realistic assumptions based on data, not ambition, to maintain investor credibility.
Avoiding these mistakes makes your model more accurate, credible, and useful for both daily decisions and long-term planning.
Tools & Templates You Can Use
You don’t need complex software to build a strong e-commerce financial model. Start simple and scale your tools as your business grows.
- Excel or Google Sheets are perfect for early-stage modeling, giving you full control over assumptions and formulas.
- Modeling platforms like Causal, Brixx, and Finmark offer automation, integrations, and visual dashboards that save time and reduce manual errors.
- Professional consulting support can help validate your model, especially when preparing for investor presentations or fundraising.
Leave a Reply
Your email address will not be published. Required fields are marked *