Scenario Planning in Excel: Learn to do it right
Early-stage startups live in uncertainty. Revenues fluctuate, costs creep in, markets shift and investors always ask: “What happens if things don’t go according to plan?”
That’s where scenario planning and sensitivity analysis come in. These two techniques allow founders to explore what-if situations and build financial models that withstand uncertainty.
Whether you’re preparing for your next fundraising round or simply trying to understand your runway, applying scenario and sensitivity analysis will help you make smarter, data-driven decisions.
Why Scenario Planning Matters for Startups
Anticipating Uncertainty in Early-Stage Businesses
No financial forecast is perfect, especially for early-stage startups where revenues, costs, and markets can shift overnight. Scenario planning in startup financial models helps founders prepare for multiple possible futures by modeling outcomes under different conditions.
For example, you can run quick what-if scenarios such as:
- What if your customer acquisition cost (CAC) doubles?
- What if churn rises by 5%?
- What if your next fundraising round is delayed by six months?
Instead of being caught off guard, scenario planning gives you a clear picture of how these changes affect your cash runway, growth trajectory, and strategic decisions.
How Investors Evaluate Your Scenarios
Investors rarely trust a single optimistic forecast. What they want to see is that you understand uncertainty and have planned for different outcomes. This is why most founders present three cases in their startup financial model:
- Base Case: The most realistic plan based on current assumptions.
- Best Case: Upside potential if growth accelerates, churn improves, or fundraising arrives on time.
- Worst Case: A conservative view that shows how the business survives if costs rise or revenue slows.
By showing investors these scenarios, you demonstrate transparency and resilience, which builds confidence in your ability to manage risk.
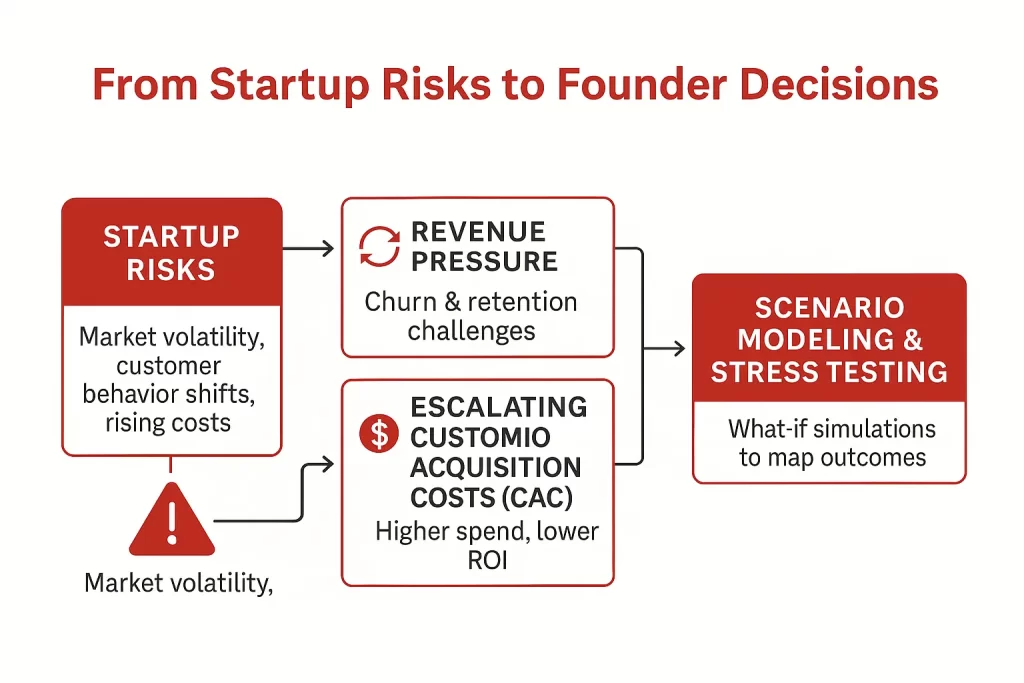
Examples of Startup Risks That Can Be Modeled
Scenario planning is most valuable when you apply it to the real risks that startups face. A few common examples include:
- Revenue growth slows because of market changes or increased competition
- Customer acquisition costs (CAC) are rising due to higher ad spend or an expanding sales team
- Team scaling too quickly, which inflates burn rate and shortens runway
- Regulatory or supply chain shocks that disrupt operations or delay growth
By modeling these risks in advance, founders can prepare strategies to protect runway and maintain investor confidence.
Instruction: “Check the boxes that apply to your business. These are the scenarios you should model first.”
What is Sensitivity Analysis in Financial Models?
Sensitivity analysis is a technique used in financial modeling to test how much your outputs (like revenue, runway, or valuation) change when you adjust a single assumption. It is sometimes called a what-if analysis because it helps answer questions such as:
- What if my churn rate increases by 2 percent?
- What if CAC rises by 25 percent?
- What if revenue growth slows by half?
For startups, this is one of the most practical ways to identify which assumptions really matter and where the business is most vulnerable.
Here’s a simple illustration of sensitivity analysis.
Key Input Variables That Drive Startup Outcomes
Not every line in your financial model has equal weight. Sensitivity analysis helps highlight the critical inputs that can make or break your startup’s projections. Common examples include:
- Customer Acquisition Cost (CAC): Even small increases in CAC can lengthen payback periods and shrink margins.
- Customer Lifetime Value (LTV): Strong retention raises LTV significantly, improving unit economics and valuation.
- Monthly Recurring Revenue (MRR): Growth in MRR is often the primary driver of investor interest in SaaS startups.
- Burn Rate and Runway: A higher burn shortens runway, forcing earlier fundraising or budget cuts.
- Gross Margin: Important for e-commerce or marketplaces where profitability depends on operational efficiency.
Identifying Critical Metrics
The power of sensitivity analysis lies in prioritization. If a 5 percent change in churn cuts your runway by six months, that is far more critical than whether office expenses increase by 10 percent. By running what-if tests, you can quickly identify which metrics deserve the most attention in board meetings and investor updates.
Pro Tip: Focus on the top three variables that move your model the most. Those are the levers you need to measure, manage, and communicate clearly to investors.
Common Mistakes Founders Make in Sensitivity Testing
Many founders misunderstand sensitivity analysis or apply it in ways that confuse investors rather than build confidence. Avoid these common mistakes:
❌ Testing every variable at once instead of isolating the most important drivers
❌ Building overly complex tables that no one can interpret
❌ Ignoring compounding effects, for example, how churn can snowball into revenue loss and higher CAC
❌ Using unrealistic ranges that make results meaningless
When done correctly, sensitivity testing highlights which assumptions drive startup success or failure and ensures your financial model tells a story investors trust.
How to Run Scenario Planning for Startups
Step 1: Define Base, Best, and Worst Cases
Start by building three core versions of your financial model:
- Base Case: The most realistic assumptions based on your current growth trajectory
- Best Case: Upside potential, for example higher revenue, lower churn, and faster fundraising timelines
- Worst Case: A conservative view with slower growth, delayed investment, and higher expenses
Step 2: Layer in Market, Cost, and Revenue Shocks
Once your three cases are set, test how sensitive they are to unexpected changes. Examples include:
- A market downturn that reduces sales by 30 percent
- A rise in CAC due to more competition in ad channels
- A fundraising delay that pushes your next round back by six months
These shocks show how resilient your model is under pressure.
Step 3: Link Scenarios to Strategic Decisions
Scenario planning is not just about numbers — it’s about decisions. Tie each scenario to clear actions, for example:
- A hiring freeze in the worst case
- Aggressive scaling in the best case
- Adjusting fundraising targets and timing depending on runway
Pro Tip: Tools like Excel’s Scenario Manager or Google Sheets’ Data Tables make it easy to run these what-if analyses without building a separate model each time.
Tools & Methods for Sensitivity & Scenario Analysis
Founders can approach scenario planning and sensitivity analysis with simple spreadsheets or more advanced software. The right tool depends on the stage of your startup and the complexity of your model.
Spreadsheet Techniques (Excel, Google Sheets)
Spreadsheets remain the most common way to run what-if analysis in startup financial models.
- Excel: Powerful features like Scenario Manager, Data Tables, and Tornado Charts make it possible to test assumptions quickly.
- Google Sheets: Built-in what-if functions and add-ons are ideal for collaboration, especially when multiple team members or advisors are reviewing the model.
Specialized Financial Modeling Tools
For founders who want more automation and investor-ready visuals, dedicated financial modeling tools can save time:
- Live Flow – Google Sheets integrations for FP&A and real-time data updates
- Foresight – Built for startups to forecast revenue, runway, and fundraising needs
- Finmark – Offers a visual approach to financial modeling with a focus on fundraising
These platforms help reduce manual errors and make your models easier to share with investors.
Visualization & Dashboards
Clear communication is just as important as the model itself. Visual outputs make it easier for both founders and investors to grasp the impact of different scenarios. Useful methods include:
- Scenario trees to map outcomes from a single decision point
- Tornado charts to rank variables by their impact on revenue, runway, or valuation
- KPI dashboards to track metrics in real time and update investors regularly
Best Practices for Investor-Ready Scenario Models
Even the best financial model can fall flat if it is confusing or overly complicated. To impress investors, your scenario planning and sensitivity analysis should be simple, transparent, and clearly tied to decision-making.
Keeping Assumptions Transparent
Investors do not expect your numbers to be perfect, but they want to understand how you got there. Always:
- Create a dedicated assumptions tab in your model
- Clearly label inputs like CAC, churn, and growth rat es
- Document sources for assumptions (historical data, market research, benchmarks)
Transparency builds trust and helps investors see that your model is grounded in logic rather than wishful thinking.
Avoiding Over-Complexity
Adding too many moving parts makes your model harder to follow and less credible. Common mistakes include dozens of tabs, excessive formulas, or minor cost categories that distract from the main story.
Keep your model focused on the 5 to 7 key drivers that determine success. If investors cannot understand it in a few minutes, they will lose confidence.
Communicating Results Clearly in Pitch Decks
Most investors will not open your full Excel or Sheets model. Instead, they expect to see the outputs summarized in your pitch deck. Make sure you:
- Present base, best, and worst case scenarios in a simple chart or table
- Use visuals like runway charts, tornado charts, or revenue comparisons
- Highlight the strategic actions you would take under each scenario
This approach shows that you not only understand the numbers but also know how to translate them into decisions.
Download the full Excel Sensitivity Planning model!
Scenario planning and sensitivity analysis transform a financial model from a static spreadsheet into a strategic decision-making tool. They help founders prepare for uncertainty, show investors you can manage risk, and guide smarter hiring and fundraising.
Leave a Reply
Your email address will not be published. Required fields are marked *